May 27 2024
Anatomy of a Hacker News traffic spike
In this article:
You’ve probably heard about the HN hug-of-death, and you know that hitting the front page of hackernews is a BigDeal™.
But how big a deal is it, really?
I’m writing this as I watch the dregs of a 20-hour traffic spike trickle through. At 6pm yesterday evening (AEDT) I shared a recent article of mine, Turn your iPhone into a Dumb Phone (dumbph.com), which Hacker News seemed to enjoy:
 With 208 points and 169 comments, this submission sits in the top ~4% of HN submissions.
I’ve always wondered — what actually happens when you hit the front page? Well, now I know. To satiate your similarly-gripping curiosity, I’ve compiled a breakdown of the traffic and documented some of the long-tail effects (like a large chunk of new backlinks, and a bunch of Twitter activity).
Note: If you’re unfamiliar with Hacker News (doubtful, you’ve probably come from there), it’s a technology news website run by the boffins at Y Combinator (a startup accelerator).
As of 2022, HN received approximately 10 million pageviews/day.
Traffic numbers
Across the 20 hour spike, I tracked about 15k unique visitors and 18k pageviews attributable to Hacker News (detailed chart below):
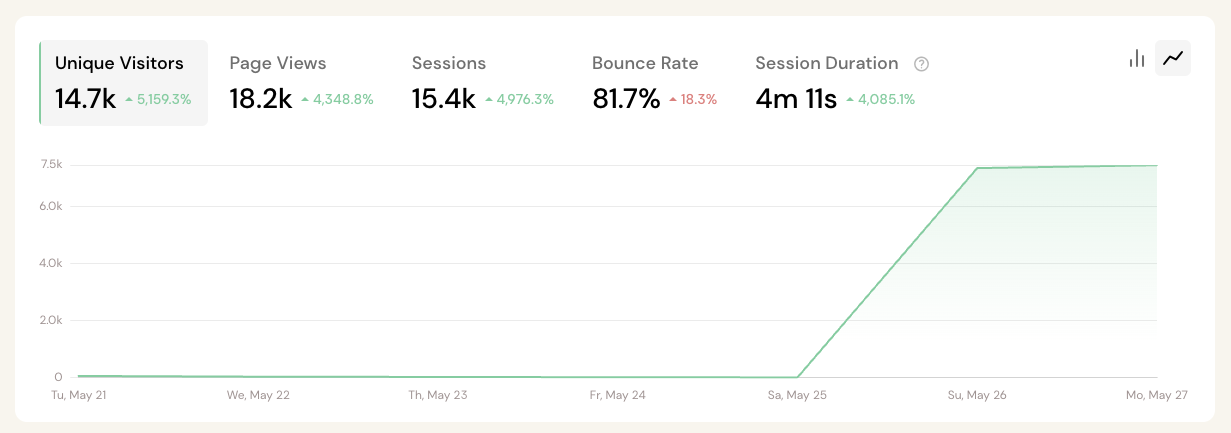 Across a 20 hour surge, I recorded approx 15k unique visitors and 18k pageviews from HN.
With a (recorded) peak of 308 concurrent users:
 I recorded a peak of 308 concurrent users from HN (although I was asleep for the tail-half of my submission’s front-page time).
15k visitors is a lot! The actual traffic numbers are a bit more opaque though (and likely larger).
My analytics provider uses a javascript snippet to track pageviews. With over 30% of people using an ad-blocker (most block javascript snippets), thousands of people likely blocked my analytics script (good for them!).
Traffic could have been closer to 20k and 24k respectively (or higher, even, if you believe the tech-savvy HN audience might have a higher usage of ad-blockers than the general population).
Honestly, the final numbers are pretty meaningless beyond satisfying my curiosity, but 15k is very much the lower bound here, not the final value. I’ve also broken down the hourly traffic below ↓
Traffic breakdown chart
Here’s the hourly traffic from Hacker News, plotted and annotated:
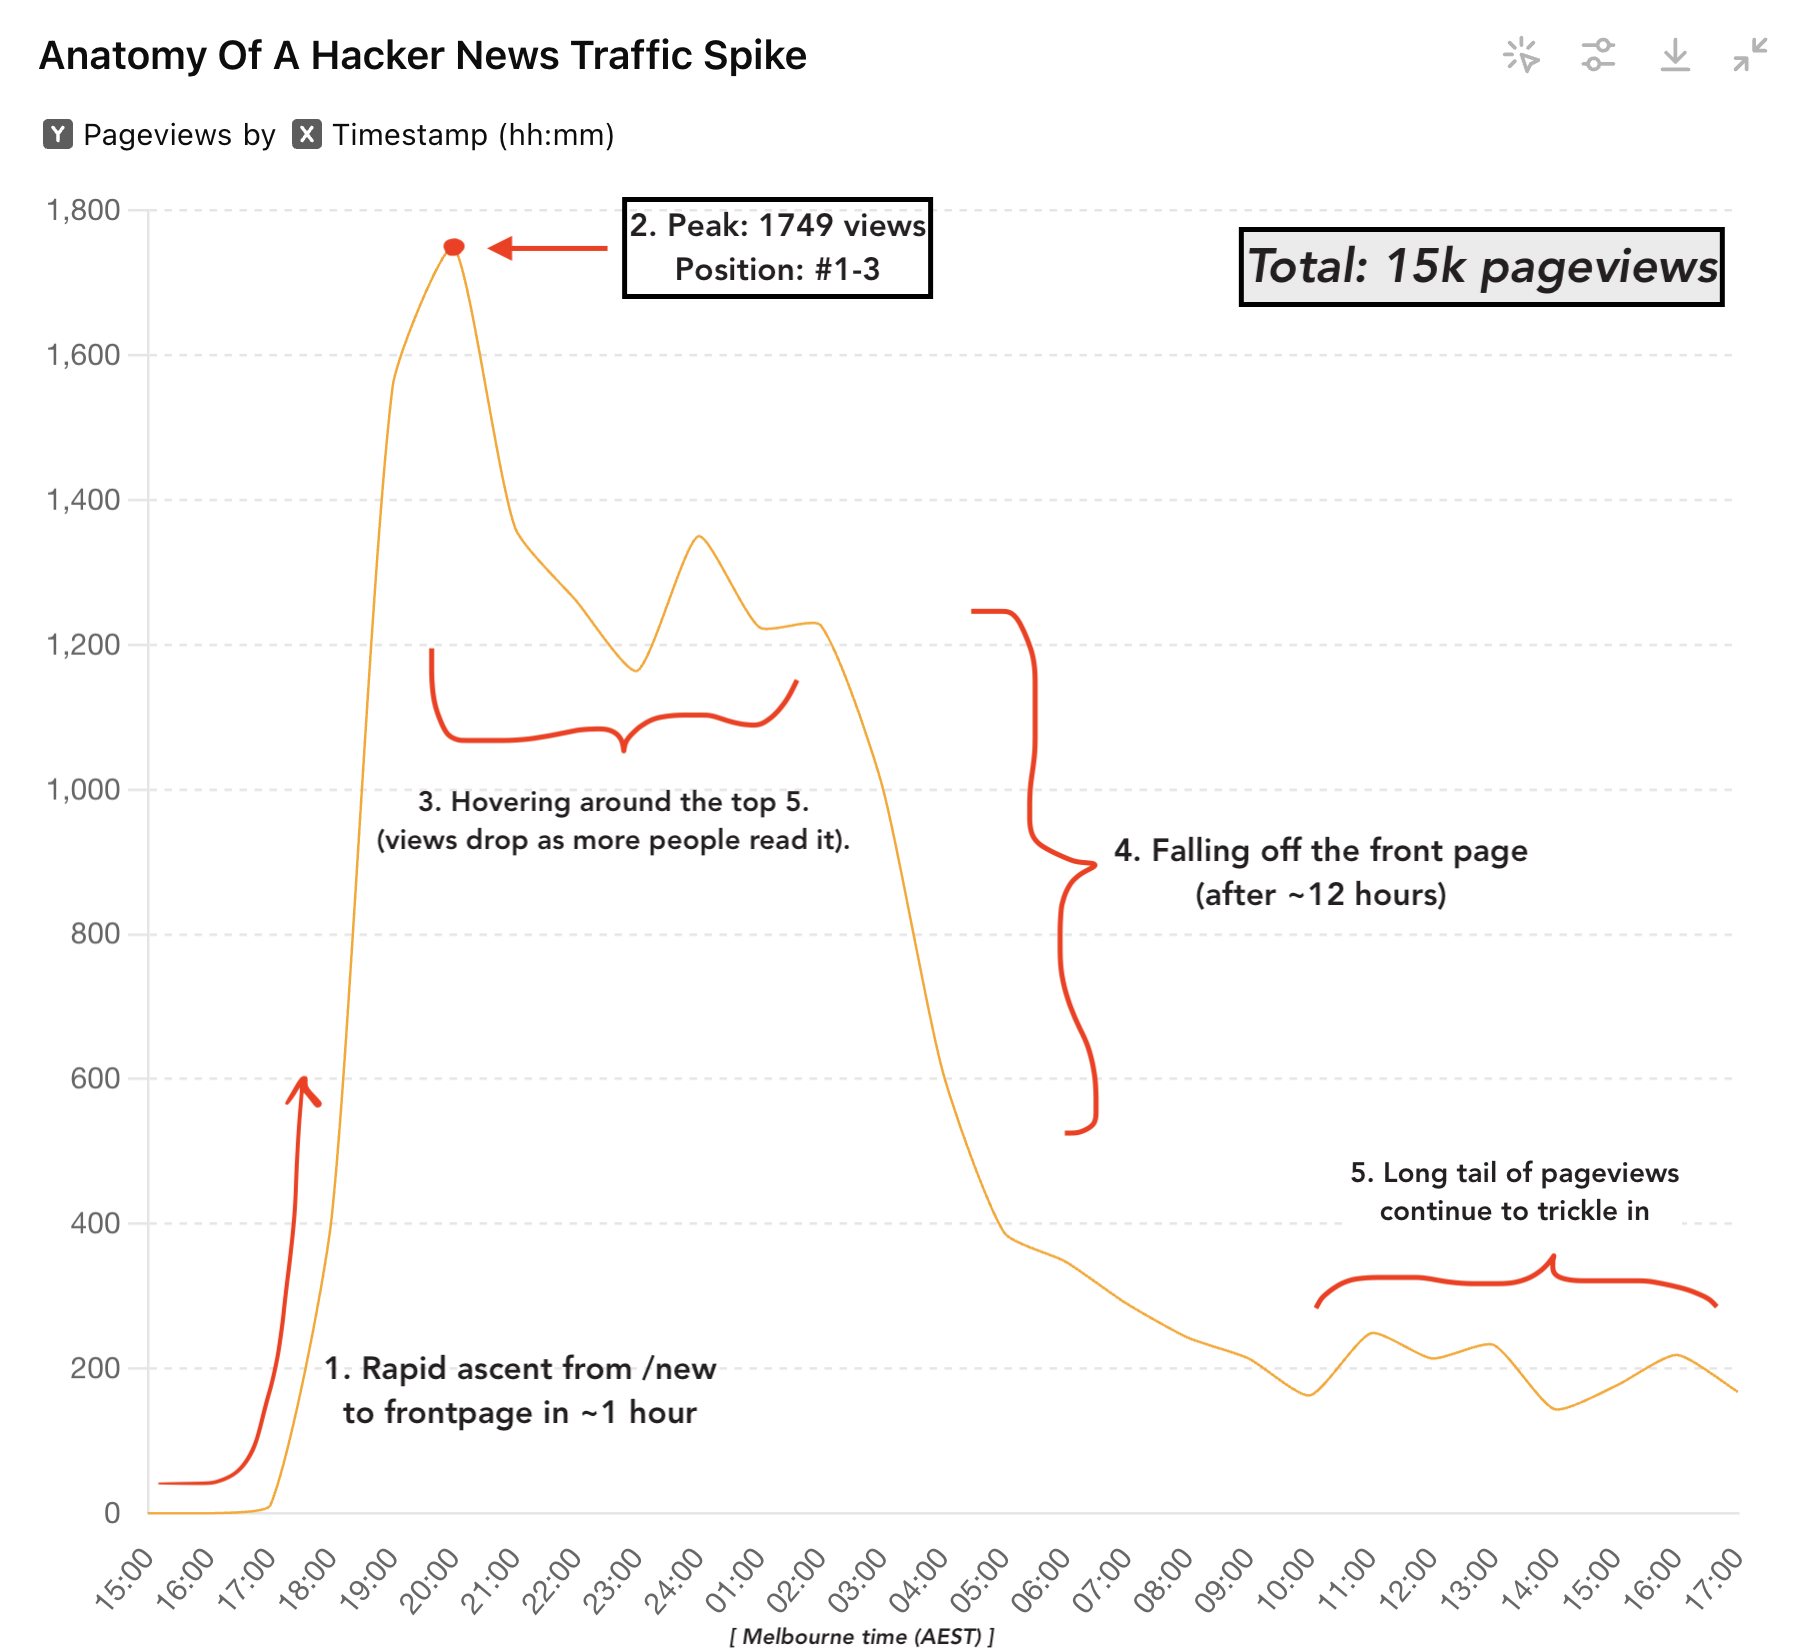 Annotated traffic breakdown of HN traffic spike.
- All new Hacker News submissions start in /new. Most die there too, but the lucky ones (that get a handful of upvotes) graduate out and can quickly rocket up the rankings. It took ~1-2 hours for my submission to ascend the frontpage.
- About 3 hours after submitting the article, pageviews peaked, at about 1.75k/hour.
- After peaking at 1.75k/hour, pageviews dropped to about 1.2-1.3k/hour for the next 6 hours. By this point, ~8 hours post-submission, over 50% of the “traffic spike” has already passed.
- Traffic plummets as the post drops and then falls off the front page.
- A trickle of pageviews continues over the next few days.
I’m interested to see how long the long-tail HN traffic lasts. I’m planning to come back and update this section with some extra info once things have quieted down.
Update: Four days on from the initial post, it looks like the final dregs of traffic have stopped. Overall, it looks like about
18kpageviews are attributable to the HN spike; an additional3kpageviews trickled in over the 72 hours following the end of the chart above.
Long-tail effects
Traffic is exciting! It gets the dopamine pulsing, but it’s a sugar hit, a one-off high. The long-term effects linger though and (hopefully) continue to deliver long after a submission has fallen off the HN frontpage.
I noticed a couple of longer-term / unexpected effects following the HN spike —
New backlinks
This traffic spike brought in 150+ new backlinks to my blog from various aggregator sites.
There are hundreds of sites that scrape or aggregate content from Hacker News, like hckrnews.com, hackerweb.app, brutalist.report and more. Over the last 24 hours, I’ve noticed a jump in the Domain Rank (DR) of my blog (as reported by Ahrefs), and a corresponding jump in Search impressions and clicks.
I’m interested to see how many of these backlinks stick around since many will fade away as my article drops off these aggregators. I’m expecting some lingering effects, although given that most of the links are relatively low-quality, I’m not sure how strong those effects will be.
Second-order social media posts (Reddit, Twitter)
Following the traffic on HN, a few tweets and Reddit posts popped up to re-share either the content itself, or the HN thread. I’ve counted 20 different tweets, and at least two Reddit posts:
 20+ Twitter accounts tweeted either the blog post link, or the HN thread.
Exciting numbers, but the actual traffic results were pretty minimal — around 100 pageviews can be attributed to Twitter and another 25 from Reddit.
Bandwidth (over)usage
The image says it all really — this traffic spike blew through ~233 GB of Netlify bandwidth over 24 hours:
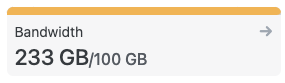 Netlify bandwidth usage was… rather large.
To be fair, my pagesize was ~8 MB (mostly images) which is on the large side (but not absurd).
That’s triggered $110 of bandwidth charges on Netlify’s part — I don’t have a billing method attached to this account, so hopefully this charge won’t go through, but it’s still pushed me to migrate my site to Cloudflare Pages, which has no such charges.
Given some of the recent horror stories related to runaway bandwidth costs, I hope this will serve as a gentle reminder to double-check your cloud host’s offerings. With zero-bandwidth-cost options like Cloudflare Pages available now, it’s harder to justify providers with pricey bandwidth (and low limits… and runaway bandwidth charges…).
Note: We can use these bandwidth figures to try and infer traffic.
233 GB / 8 MB = ~30k, potentially giving us a better idea of the true traffic numbers from this spike.
A friendly email
Despite the traffic, maybe the real treasure was the friends we made along the way. The morning after submitting my article, I woke up to a lovely email from Jay Olsen, a researcher in the field of smartphone addiction.
As it turns out, he’s done quite a bit of research into dumbing down smartphones, and I’m currently working my way through his research papers and I’m hoping to write more about them soon.
It’s a small thing, but I wouldn’t have expected this kind of serendipity from… just about any other site except Hacker News.
Conclusion
I hope you found this article informative!
Traffic, hits, pageviews — it’s exciting, and if you can harness it (via new sign-ups to your startup, a mailing list etc.) then it can give your project a real boost.
Traffic is, of course, completely transient, which is why some of the long-tail effects excite me just as much — being able to consistently drive a trickle of new traffic to a site thanks to some strong backlinks is just as exciting to me as the initial surge.
I don’t just write in a vacuum for the empty pursuit of traffic-for-traffics-sake, though. In this case, I wanted to help people reclaim some small amount of control over their digital lives, by making their iPhones less engaging. Between the pageviews, the comments on HN and Twitter, and the serendipitous reveal of a whole body of research on the same topic, I think I managed to do that.